Monitoring & alerts
Watch every server's CPU, memory, and disk from one page instead of opening each one. Monitoring has three tabs: Metrics for live usage, Uptime for reachability checks, and Alerts for the threshold rules that email you when a server runs hot. The page refreshes on its own.
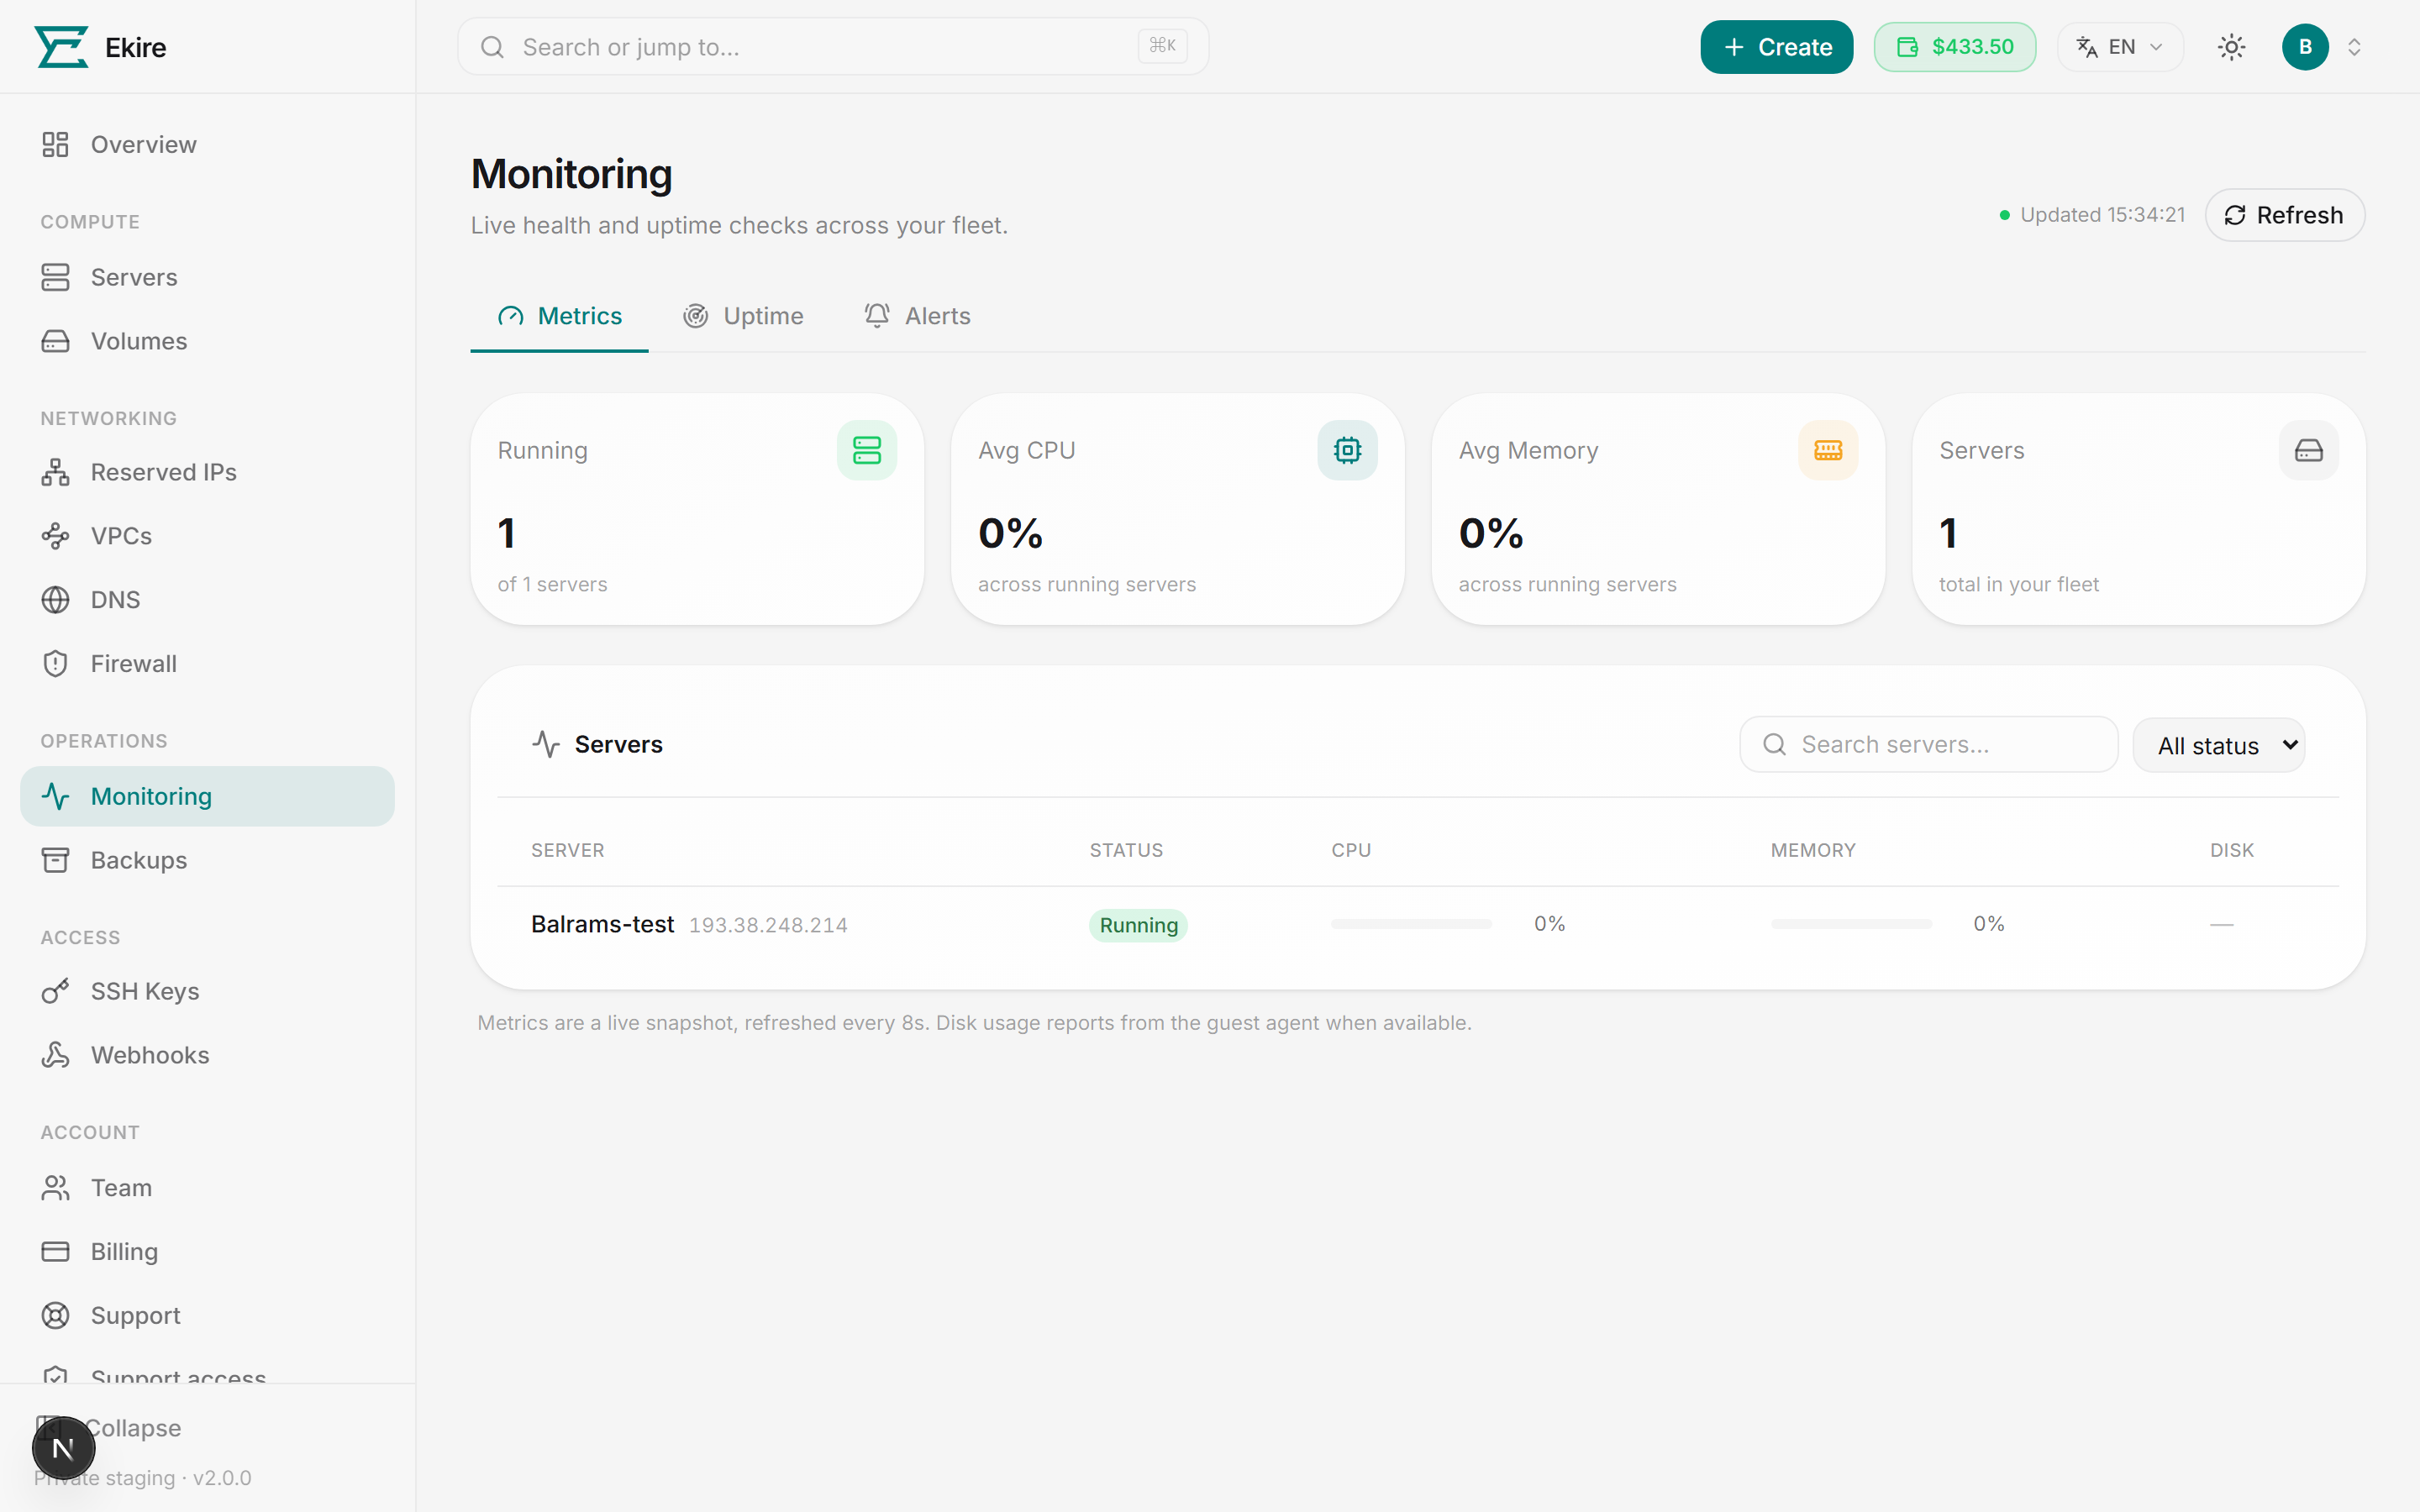
Live metrics
The Metrics tab opens with summary tiles:
- Running — how many servers are powered on, out of your total.
- Avg CPU — average CPU usage across your running servers.
- Avg Memory — average memory usage across your running servers.
- Servers — the total number of servers in your fleet.
Below the tiles, the Servers table gives you a live row per server:
| Column | What it shows |
|---|---|
| Server | The server name (links to its detail page), with its IP address alongside. |
| Status | Whether the server is running, stopped, and so on. |
| CPU | Live CPU usage, as a bar and a percentage. |
| Memory | Live memory usage, as a bar and a percentage. |
| Disk | Live disk usage, as a bar and a percentage. |
Each usage bar is color-coded: green below 60%, amber from 60% up to 85%, and red at 85% or above. When a metric isn't being reported, you'll see a dash instead of a bar.
Disk usage needs the guest agent
Disk usage is read from the guest agent inside the server, so it only appears when the agent is running. CPU and memory come from the hypervisor and are always available for a running server.
To work through a larger fleet, use the search box to find a server, and the status filter to show All status, Running, or Stopped only. The table pages 25 servers at a time, with Prev and Next at the bottom.
The metrics are a live snapshot, refreshed every 8 seconds, and the Updated time and a Refresh button sit in the top-right if you want to pull the latest reading yourself.
When metrics can't be reached
If the hypervisor is briefly unreachable, a banner tells you live metrics are unavailable right now — your server status is still accurate, but the CPU and memory averages show a dash until the reading returns.
Uptime checks
The Uptime tab probes each server's public IP from Ekire and records what came back. No agent is required — the check runs from the outside. Use Add monitor to set one up. Pick a Check preset to fill the rest of the form for you:
- SSH — a TCP check on port 22.
- HTTP — an HTTP request on port 80.
- HTTPS — an HTTPS request on port 443.
- Custom TCP — any port you like.
You give the monitor a Name and a Port, and for HTTP/HTTPS checks a Path to request (it's counted up on a 2xx or 3xx response). Each monitor shows its latest status — Up, Down, or Pending — its latency, and when it was last checked. A monitor on a stopped server, or on one with no public IP, sits at Pending: there's nothing listening for the probe to fail against. You can pause a monitor to stop checking it, or delete it to remove it for good.
Uptime results stay on this page
A check going down updates this tab and nothing else — no mail, no notification. The alert policies below are the part that emails you, so a server you need to hear about is worth a threshold rule as well.
Create an alert policy
Open the Alerts tab and choose Add alert. A policy watches one metric on one server and emails you when live usage crosses the threshold you set. The form takes:
| Field | What you set |
|---|---|
| Server | The server to watch, from a list of your servers. |
| Metric | CPU usage, Memory usage, or Disk usage. |
| Threshold (%) | The usage level that trips the alert. It fires at or above this value. |
| Sustained for (min) | How long usage must stay at or above the threshold before it fires. 0 means the moment it's seen. |
Open the Alerts tab and click Add alert
The Add alert button is disabled until you have at least one server, so deploy a server first if the button is grayed out.
Pick the server and metric
Choose which server to watch and whether to track CPU usage, Memory usage, or Disk usage.
Set the threshold
Enter the usage percentage that should trip the alert. It fires at or above this level.
Set how long it must be sustained
Enter the number of minutes usage must stay over the threshold before firing. Use 0 to fire as soon as
a breach is seen, or a few minutes to ignore brief spikes.
Add the alert
Click Add alert. The policy appears in the list right away and starts watching.
Limits the form enforces
The threshold must be between 1 and 100% — anything outside that range is rejected. The sustained window can be 0 to 1440 minutes (up to 24 hours). One policy per server per metric: a second CPU alert on the same server is refused. The list has no edit control, so changing a policy's threshold or sustained window is done through the API — or delete it here and add it again.
What triggers a notification, and how you're told
A policy fires once the metric stays at or above the threshold for the sustained window you set. When it fires, Ekire emails the account owner. It emails again when usage drops back and the alert resolves.
Email on state changes only
Notifications are sent on transitions — when an alert starts firing and when it resolves. You won't be emailed again and again on every check while a server stays hot.
Two cases where a policy stays quiet. A stopped server has no live load, so nothing is evaluated against it and a firing alert clears silently when you power one off — you asked for the stop, so an all-clear email would be noise. And a disk policy needs the guest agent, for the same reason the Disk column does: with no agent reporting, there's no reading to compare with your threshold and the policy never fires.
You can also track each policy right in the list. Every alert shows its metric and threshold (for example,
CPU ≥ 85%), a Firing or OK status chip, the current reading, and — when it's firing — when it
started firing (a Firing since … line). Use the controls on each row to pause a policy (it keeps the rule but stops
watching and emailing) or delete it entirely.